LLM Observability: Production Traces, Costs, Quality, and Alerts
Niraj SalotOctober 26, 2026
Share this article


Let AI highlight what matters.
Tracks AI response quality, latency, token usage, and costs.
Helps detect incorrect answers and issues that standard monitoring may miss.
Monitors AI agents’ decisions, tool usage, and task completion.
Uses tools like Phoenix and Langfuse for tracing and debugging.
Improves AI reliability, controls costs, and protects sensitive data in production.
Key takeaway: LLM observability makes AI applications more reliable, accurate, and cost-effective.
A customer assistant functions efficiently by providing immediate feedback with the HTTP 200 status code while also providing outdated information on refund policies. The infrastructure dashboard remains unperturbed. However, the customer is left in the dark with incorrect information.
LLM observability connects each request with information on its execution duration, the cost of its execution, and the quality of the answer. This makes it easier to find the root causes of errors of such a nature that cannot be explained using standard methods of monitoring availability.
NextGenSoft’s case study of context engineering demonstrates that accuracy of routing for the same model increased from 70% to 90% due to changes in tagging and retrieving inputs. This means that the increase was 20 percentage points and does not imply universal effectiveness. The question is how to obtain the information necessary to troubleshoot.
Application performance monitoring (APM) is still important for HTTP error monitoring, database performance processing, and for infrastructure health check monitoring. However, conventional monitoring needs extra elements to successfully monitor and analyze such aspects of language-model applications:
Several APM products are equipped with unique features of artificial intelligence. The critical steps will involve analyzing the integrations and integrations that come with your specific products and not presuming that all products must be updated and revised at least to some degree.
Read Also: What Is a Private LLM? Benefits, Use Cases & Business Need
In this case, you can start with 5 types of key information – this information will describe the case regarding the current case.
You can create a path of a specific request. The span may represent an operation related to the request. Each of the paths must be organized using the ID of the trace as well as the information regarding the parent-child relationship between the operations.
The OpenTelemetry GenAI span conventions define some fields of operations of models that include information regarding their provider and usage. Specify the conventions and versions of equipment that you use, as the specifications are being updated.
Make sure to log the number of input tokens and the number of output tokens for each request separately, assigning costs to the specific features, models, and processes used. Be aware that making multiple calls (some of which may be incorrect) has implications on costs.
To get the costs of a token-based request, compute costs according to the following formula: costs = number of input tokens × input rate + number of output tokens × output rate.
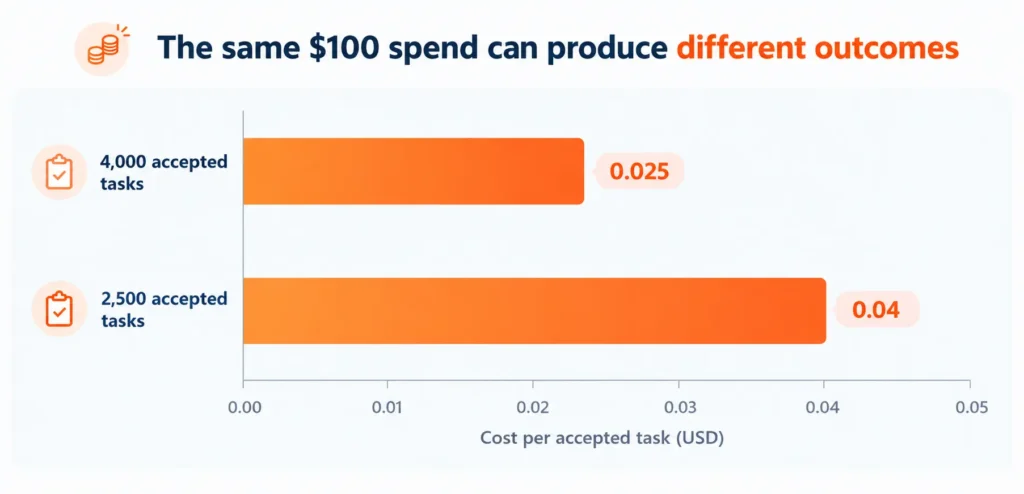
For instance, if the total spend is $100 and 4,000 tasks were accepted, the cost per accepted task will be $0.025. However, if, with the same expenditure, only 2,500 tasks were accepted, the cost will go up to $0.04, which is a 60% increase in cost. Use precise definitions of the concept of “accepted” in line with the specific business goal you are working with.
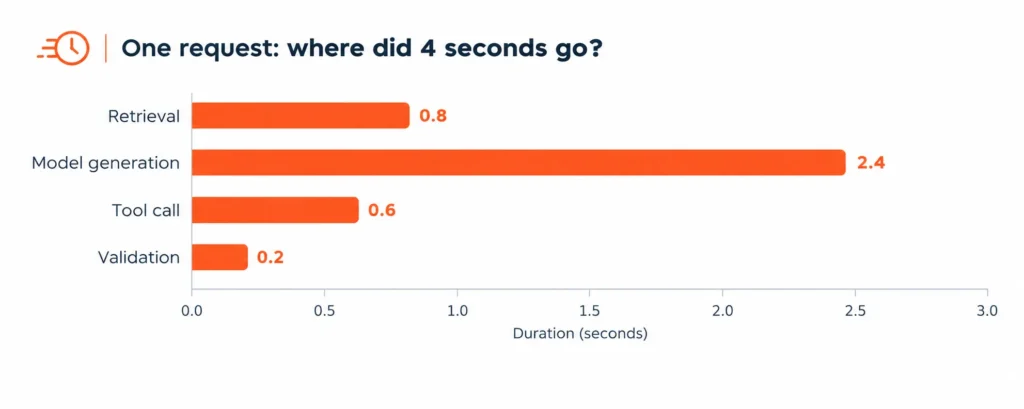
Keep track of total time taken, including retrieval, generation, and the call durations. In case of streaming applications, separate the time taken to get the first token from the time for completing the task.
Use percentiles: p50 marks the median in the bunch while p95 is the time under which 95% of the requests were completed. Carry out a comparison only for similar types of routes and workloads; an answer to an FAQ and a research task have different service-level goals (SLGs).
See the critical path when the operation works in parallel. Summation of all spans will result in the exaggerated waiting time experienced by the user.
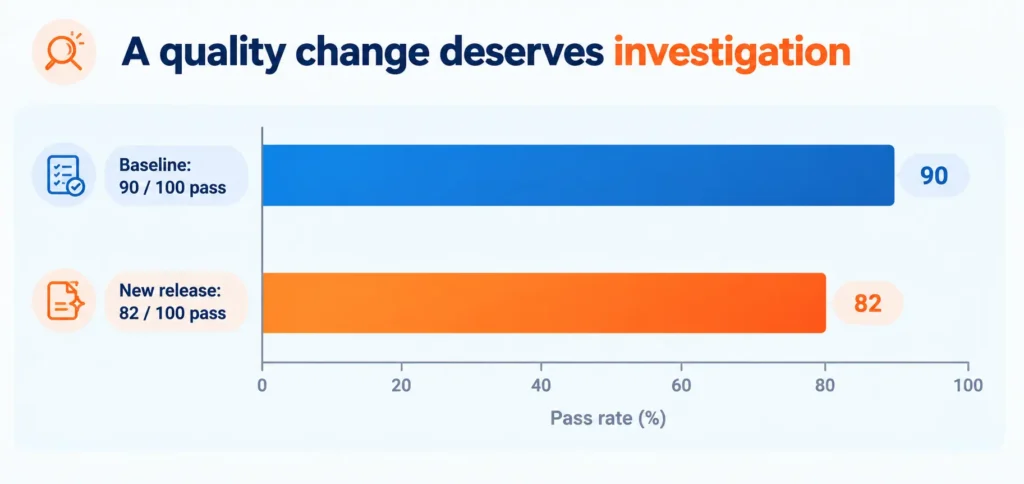
Evaluation of the LLM produces outputs that are being compared against the defined criteria. Observability relates these scores to the prompt, model used, retrieved content, and the path taken to get these scores. Keep the detailed methodology aside and utilize the methodology outcomes to identify changes in production.
Graders that are based on certain models can aid in analyzing additional, larger sets, but their grades cannot be treated as exact. It is necessary to change the version of the grader and rubric and compare the findings with those of human reviewers.
Drift means that there are changes in the traffic, context, or results that the system has received. Compare such metrics as the topic distribution, languages used, prompt lengths, retrieval coverage, tools employed, and quality according to the user category.
AI agent observability tracks agents’ actions, tools used, handoffs made, and results obtained throughout the entire execution. It goes beyond just one model’s response due to the fact that there will often be multiple decisions made prior to completion.
Some helpful principles of AI agent observability include recording agent role, permissions used, decision finalization, tools utilized, recipient of handoff, and termination justification.
Make use of limitations on execution time and expense in your application code. Although alerts can prevent an infinite loop from happening, they cannot stop it on their own. For specifics on access control procedures, please refer to NextGenSoft’s guide to securing AI agent identity.
The entire LLM observability industry includes a wide range of open-source backend technologies, managed service providers, and various AI components within bigger monitoring solutions.
For example, Phoenix documents OpenTelemetry-based tracing, while Langfuse documents OpenTelemetry ingestion. Langfuse offers self-hosting and a managed service, with some self-hosted add-ons requiring a license.
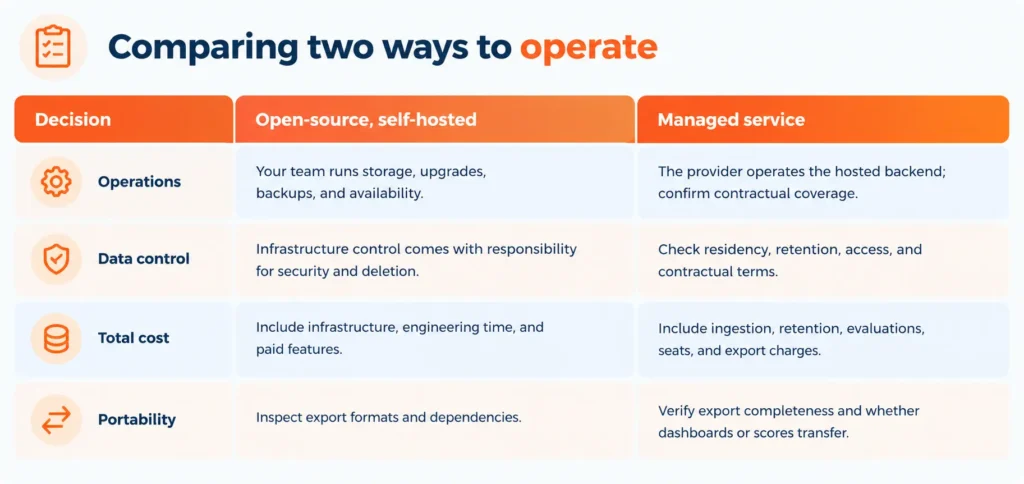
Shortlist your preferred LLM observational tools using your custom reference traces. Look into ingestion, redaction, debugging, evaluation association, and export before making a choice.
While evaluating the AI agent observability apps, also check for nested executions, asynchronous transfers, and identity signature reconciliation. So-called production-level AI agent observability tools ought to prove these abilities under your workload.
Our LLM Integration Services cover prompt engineering, output validation, cost optimization, latency tuning, and fallback handling. Its service page describes a model-agnostic approach across commercial and open-source options.
When engaging in the production process, it is vital to establish the necessary evidence beforehand that your team needs, including traceability of the workflow, relevance attribution, a standard baseline of data quality, and created alert runbooks. Consult NextGenSoft now so that the monitoring provisions will be included in the integration scope.
1. What is LLM observability, and why is it needed in production?
Answer: LLM observability is the process that allows you to follow the performance of any particular language-model-based application by tracking requests, responses, token usage, response time, and answer quality.
2. Which metrics should you track in an LLM application?
Answer: For LLMs, you need to keep track of such metrics as input and output tokens, the price for executing the task, response time, errors, and task quality.
3. How is LLM evaluation different from production monitoring?
Answer: The point of LLM evaluation is to decide if a certain output measures up to specified standards of correctness, relevance, or task execution success.
4. What is AI agent observability?
Answer: AI agent observability is concerned with tracking every element of agent operations, starting from calling itself and proceeding with the application of tools, making retries, and delegating the process. It enables teams to identify where the failure occurred, whether a certain action was allowed, and why the operation required more time or spending than expected.
5. How should a business choose between open-source and managed LLM observability tools?
Answer: Select depending on your data needs, engineering capabilities, integration requirements, and overall operational costs.
 Niraj Salot
, with 20+ years of expertise in software architecture, specializes in delivering robust enterprise applications. His cloud optimization skills help clients cut costs while maximizing performance. As a key leader at NextGenSoft, he drives scalable, efficient, and high-performing solutions.
We’re ISO/IEC 27001:2022 certified, ensuring your projects are executed with globally recognized security standards.

INDIA
 sales@nextgensoft.io
 +91 81284 66678


