Business Intelligence Consulting: When to Hire a BI Partner
Kushal BaldevOctober 1, 2026
Share this article


Let AI highlight what matters.
Your sales dashboard shows revenue growing. Finance reports a lower figure. Meanwhile, operations are still combining spreadsheets before Monday’s meeting.
Buying another reporting tool might improve the presentation. Resolving those differences requires examining how the numbers are collected, calculated, and shared.
Business intelligence consulting helps organizations build reliable reporting by connecting data, defining metrics, designing dashboards, and preparing people to use them. A tool may be enough when those foundations already work. A partner becomes useful when they need attention.
The challenge is widespread. On its State of Data and Analytics report page, Salesforce reports that data and analytics leaders consider 26% of their data untrustworthy. That is a survey finding, rather than a measurement of every company, but it highlights why attractive dashboards can still leave managers uncertain. Salesforce
Here is how to decide what your organization actually needs.
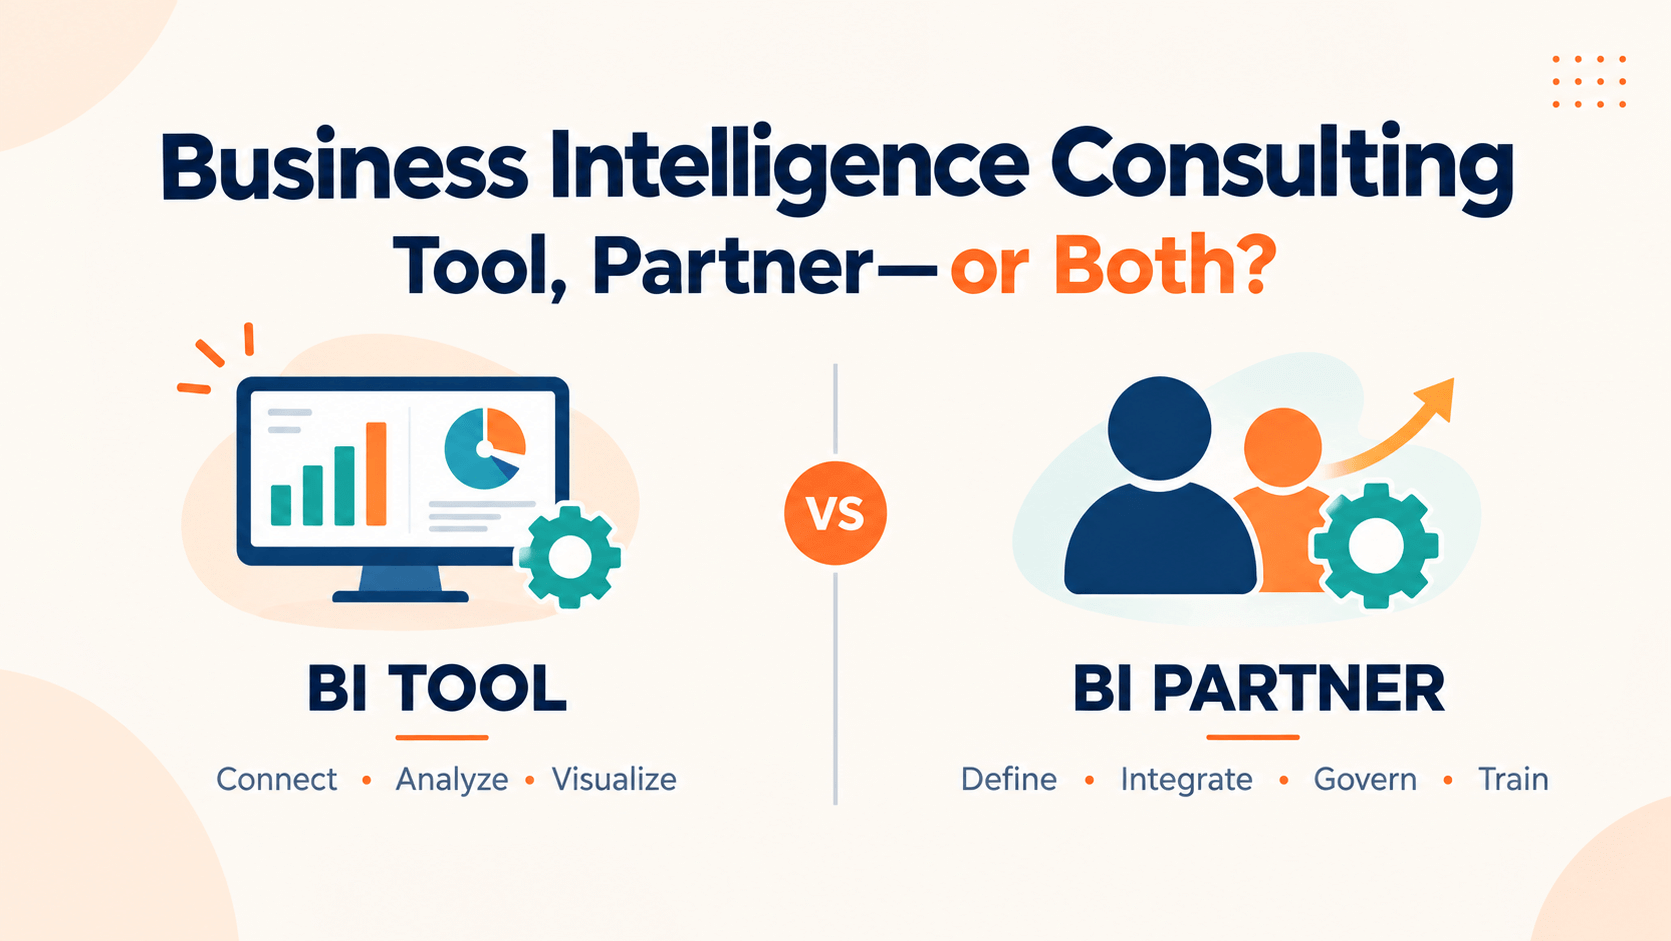
Power BI and Tableau provide software for connecting, analyzing, and presenting data. A consulting partner helps decide how to apply those capabilities to your business.
The distinction matters because software cannot decide whether your definition of “active customer” is commercially useful.
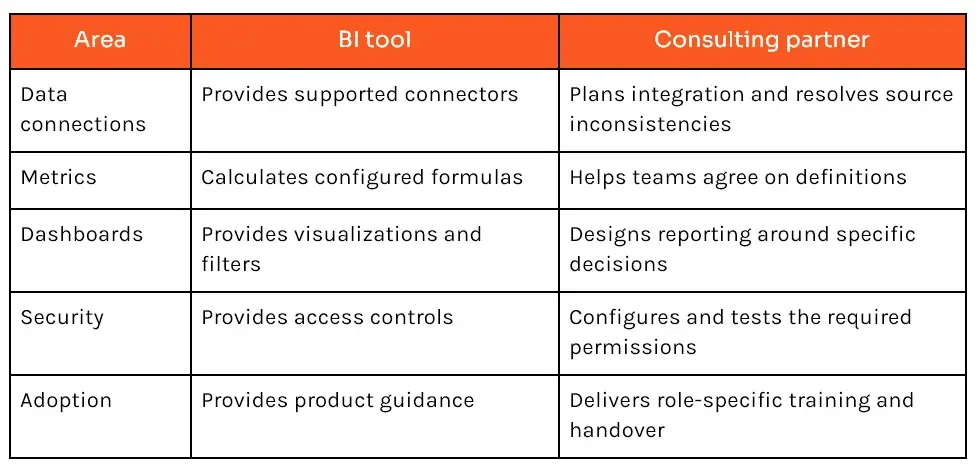
Consider a distributor comparing product profitability. The software can chart sales and costs. Someone still needs to decide how returns, shipping charges, and discounts affect margin.
If your internal team can make and maintain those decisions, a tool purchase may be sufficient. If responsibility is unclear, external expertise can help establish a workable approach.
Read Also: Mastering Power BI Embedding: A Comprehensive Guide for Developers
Self-service reporting works well when users have dependable data and clear boundaries. Problems emerge when individual reports become the organization’s main reporting infrastructure.
Sales counts signed contracts. Finance counts recognized revenue. Both figures may be correct, yet the dashboard labels both “revenue.”
A partner can help distinguish the measures, document their definitions, and assign ownership. The goal is to make differences explainable before they disrupt decisions.
Watch for recurring tasks such as:
Taking as an example, four analysts preparing reports spend three hours each week for that purpose, thus accumulating 624 hours a year, provided there are 52 weeks of work. This is a hypothetical workload calculation, not a promised saving. It provides a useful starting point for measuring your own reporting burden.
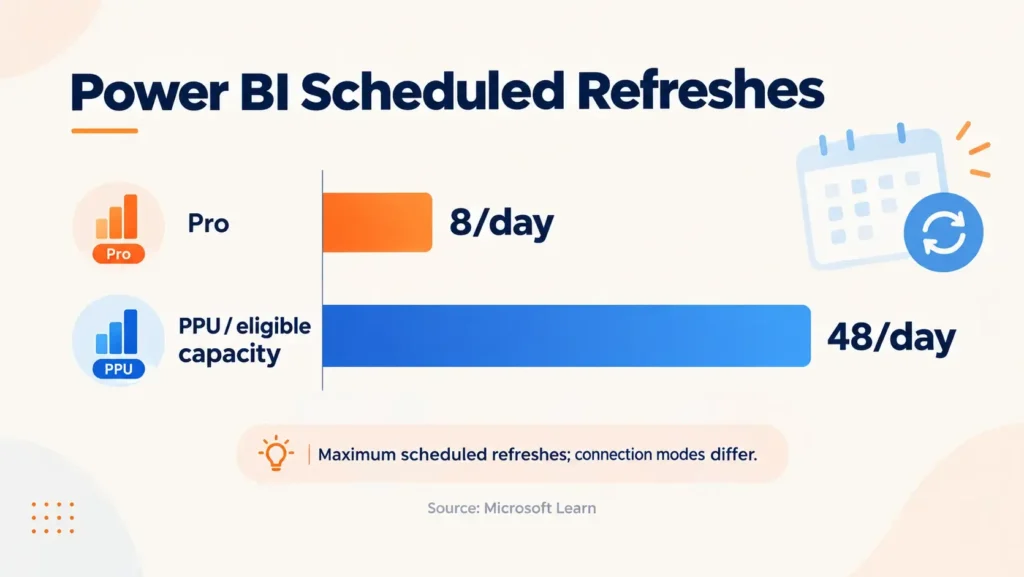
A daily refresh may suit a monthly financial review. It may be inadequate for monitoring fast-moving inventory.
Microsoft documents a maximum of eight scheduled refreshes per day for Power BI Pro, compared with 48 for Premium per user and specified Premium/Fabric capacities. These limits concern scheduled refreshes; DirectQuery and live connections work differently.
The right response depends on the reporting requirement, source system, and architecture. A higher license tier alone may not solve the problem.
More departments bring different permissions, reporting priorities, and support needs.
If nobody owns metric changes or failed refreshes, the system becomes fragile. Strong business intelligence services address these operating responsibilities alongside report development.
A useful engagement begins with decisions people need to make. Dashboard design follows from those requirements.
Consultants review users, source systems, existing reports, and recurring problems.
The output should identify:
For example, “reduce weekly report preparation from six hours to two” is a proposed target that can be tested. “Improve visibility” needs further definition.
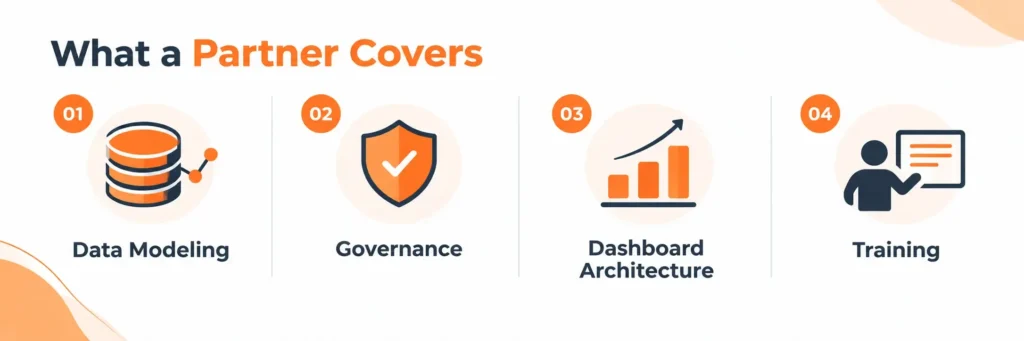
Integration brings relevant records together. Modeling establishes how those records relate and how calculations behave.
An order may contain several items and several shipments. Joining those records incorrectly can multiply rows and inflate revenue.
Microsoft’s Power BI guidance explains the role of star schemas, which separate measurable events from descriptive information such as customers, products, and dates. This structure supports model performance and usability when applied appropriately.
Ask for documented relationships, reusable calculations, and reconciliation against trusted source totals.
Governance provides clarity on data ownership, authorization for updates, and examination of discrepancies.
The products offered usually consist of a dictionary of metrics, access regulations, control over quality, and proof of the origin of figures.
Security also requires testing. Microsoft notes that Power BI row-level security restricts users with Viewer permissions; it does not apply to workspace Admins, Members, or Contributors. Assigning workspace roles therefore matters as much as defining filters.
Different users need different reporting views. Executives may need a performance summary. Regional managers need exceptions and comparisons. Analysts need detailed exploration.
Where appropriate, these views should share a governed model rather than duplicate calculations across separate files.
For reporting inside an application, NextGenSoft’s Mastering Power BI Embedding explains embedding and access considerations.
Users need to understand what a metric means, how filters affect it, and when the underlying data was updated.
Administrators need additional guidance on refresh failures, permissions, releases, and maintenance.
If ongoing support is required, managed BI services can cover monitoring and improvements under an agreed scope. Confirm responsibilities and response arrangements before signing.
Choose according to the capability missing from your organization.
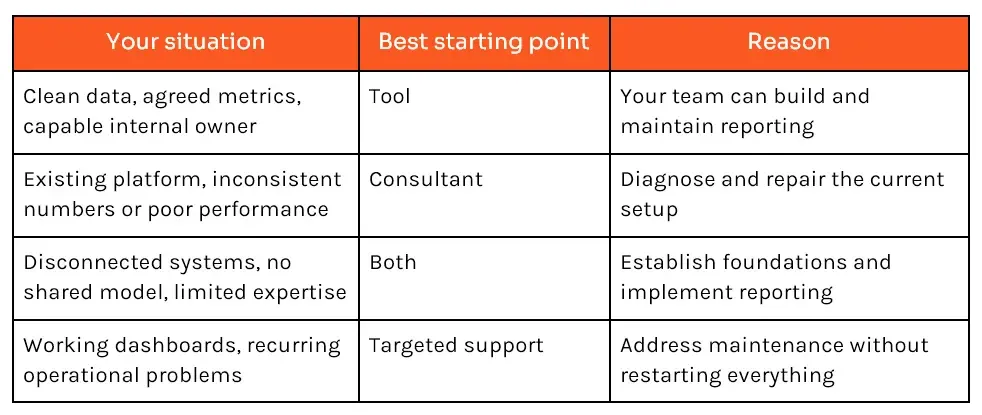
Ask three questions:
A clear “yes” across all three favors internal delivery. Several “no” answers suggest a broader engagement.
For organizations considering infrastructure changes, Cloud Business Intelligence Solutions for Enterprises provides related background on cloud delivery.
The process of comparing the leading BI consulting companies is easier when their results and achievements are given more thought than their presentation.
Ask candidates to explain:
Request a relevant example with clear scope and measurable outcomes. A visually impressive portfolio does not establish how well a partner handles your reporting constraints.
Also compare total cost: licensing, infrastructure, implementation, internal staff time, and support.
A dashboard tool can be enough when your data, definitions, and internal capability are sound. A partner becomes valuable when reporting problems span systems, departments, or responsibilities.
Business intelligence consulting should leave you with dependable numbers, usable reports, and clear ownership.
NextGenSoft’s published offering includes data engineering, visualization, self-service BI implementation, and data architecture support. Explore its Data Science Services to discuss your reporting challenges and the appropriate engagement scope. Bring examples of conflicting reports, manual preparation tasks, and decisions your current dashboards cannot support.
1. What is business intelligence consulting?
Answer: Prices depend on the source systems, data quality, integration difficulty, security demands, and scope of delivery. The only way to get a precise price for a BI project is to ask your partner to give you an estimate consisting of all items, such as assessment, implementation, license, infrastructure, training, and ongoing support.
2. Can consultants improve our existing Power BI dashboards?
Answer: Yes. An engagement can focus on calculations, performance, refresh reliability, permissions, or usability. Replacing the platform should follow an assessment showing why the current setup cannot meet requirements.
3. How much does a BI engagement cost?
Answer: Cost depends on source systems, data quality, integration complexity, security requirements, and delivery scope. Request an itemized proposal separating assessment, implementation, licensing, infrastructure, training, and ongoing support.
4. How does BI differ from artificial intelligence business consulting?
Answer: BI generally supports reporting and analysis of business performance. AI consulting may address prediction, language processing, or automated recommendations. The work can overlap, but AI features still require reliable data and validation.
5. Is cybersecurity intelligence business consulting included?
Answer: That phrase generally points toward security-focused analysis, such as threat information or exposure reporting. A standard BI project may provide security dashboards, but threat detection and incident response require specialist capabilities and explicitly agreed responsibilities.
6. How should we measure whether the project worked?
Answer: Detecting success is possible by comparing results obtained with the initial situation. The most meaningful indicators may be considered:
 Kushal Baldev
Kushal Baldev is currently serving as a Technical Lead at NextGenSoft, bringing over 8.5 years of experience in software development and technology leadership. With a strong background in designing scalable systems and leading high-performing teams, Kushal has played a pivotal role in delivering innovative solutions across various domains.At NextGenSoft, he leads cross-functional teams, mentors junior developers, and collaborates with stakeholders to drive digital transformation initiatives. His dedication to continuous learning and staying updated with emerging trends has made him a valuable asset in the tech community.
We’re ISO/IEC 27001:2022 certified, ensuring your projects are executed with globally recognized security standards.

INDIA
 sales@nextgensoft.io
 +91 81284 66678


